The Largest Online Community for Contact Centre Professionals
The Largest Online Community for Contact Centre Professionals

12th April 2022
When calculating metrics like Average Handling Time (AHT), After Call Work (ACW), or Average Talk Time, the method you choose can significantly impact your results.
Eric had a query about this and asked our Community :
Can some one please tell me the correct average method to use when working out averages such as AHT, Avg ACW, Avg Talk Time?
If I use the ‘mean’ average to work out lets say the AHT, the average will be skewed if the data consists of some very high ACW or Talk Times. Shouldn’t we be using the ‘median’ average instead to work out the above metric if we want to set an accurate baseline average?
This question raises a common issue in reporting call centre metrics, where a few extreme values can distort averages. In response to his query, we’ve gathered useful insights and suggestions from our community of industry professionals.
To report an accurate AHT, you should use a weighted average.
For example:
Total = 88,600 seconds ÷ 352 calls = 252 seconds AHT.
In Excel, you can use the SUMPRODUCT function to calculate this.
The weighted average ensures that the majority of your AHTs (around 250 seconds) have more influence, while a few high AHTs (like 600 seconds) have minimal impact.
For forecasting AHT, I use a Poisson distribution, which is a discrete probability distribution that expresses the probability of a number of events occurring in a fixed period of time.
Contributed by: Michael
This is a simple but important question we often overlook. The right answer depends on why you want to know your AHT. Here are a few points to consider:
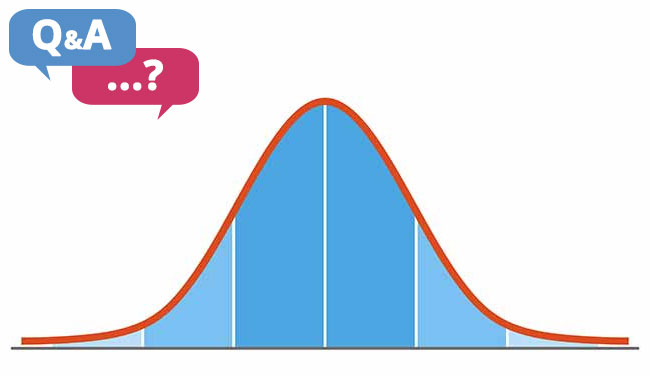
There are three common measures of central tendency: mean, median, and mode.
The mean is the most common measure and is best for when data is evenly distributed and you want a general average.
It is simply the sum of all values divided by the number of values. However, it can be misleading if your data is skewed by a few extreme values.
The formula to work out mean is:
Mean Average = Total Time ÷ Number of Calls
Example
If call durations are 250, 250, and 600 seconds:
Mean AHT = (250 + 250 + 600) ÷ 3 = 366.67
If most calls are 250 seconds but a few are 600 seconds, the mean will be higher than most individual call lengths.
The median is often a better choice when the data is skewed and you want to avoid the influence of extreme values. It represents the middle value when all data points are sorted in order, with 50% of the values higher and 50% lower.
Example
If your call lengths are: 250, 250, 250, 600, 600
The median is 250, as it’s the middle value when the data is ordered.
The mode is the most frequent value in the data set, and is useful for understanding the most common value, especially in cases with repeated call lengths.
If you categorise call lengths into intervals (e.g., 15 or 30-second units), the mode tells you the most frequent call duration.
Example
If your call lengths are: 250, 250, 250, 600, 600
The mode is 250, as it appears most frequently.
If you’re interested in how agents vary in handling calls, you may want to look at variation, such as the standard deviation.
Contributed by: Guy
This article was made possible due to the great community of experts we have at Call Centre Helper, to get involved just join our LinkedIn Community and and if you aren’t already make sure you are following us on LinkedIn to see our latest content.
For more on calculating Average Handling Time, read these articles next:
Jonty Pearce walked into his first call centre in 1989 and has been hooked ever since. He founded Call Centre Helper in 1989.
He is an Engineering Graduate with a background in marketing and publishing. In 2020 he won the AOP Digital Publishing Award for The Best Use of Data.
He writes and speaks on a wide variety of subjects - particularly around forecasting and scheduling. His in depth knowledge of forecasting algorithms has earned him the nickname "Mr Erlang."
Connect with Jonty on LinkedIn
Read more by Jonty PearceReviewed by: Robyn Coppell
The Latest Customer Contact Research, Reports and White Papers straight to your inbox!
Get the latest insights from Call Centre Helper by signing up for our email content.


24th September 2025
From Insight to Impact: The Next Era of CX and AI Leadership – Webinar