14th October 2009

Many call centres struggle to measure performance, as easy inbound metrics, like C-SAT, may not be fully relevant.
This productivity and performance measuring guide, provided by Mats Rennstam highlights the most effective things to measure in your call centre.
Service Level Dilemma
What is easy to measure is not necessarily what is most relevant to measure.
A classic example of this is the 80/20 calls-answered service-level target that so many organisations still have, where 80% of the calls should be answered in 20 seconds.
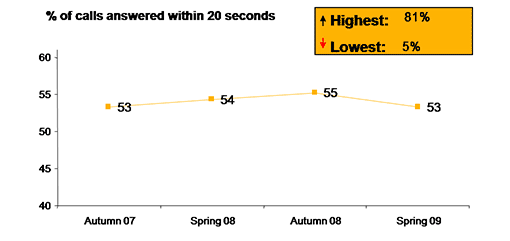
Very few centres reach this mark (the average is 55% of calls answered within 20 seconds*) and yet it persists, driven, we believe, by senior management’s desire to have one number to focus their efforts on.
Most centres genuinely believe that achievement of this service-level target is key to delivering customer satisfaction, but when measuring what the impact of a 30-second shorter hold time is, we see that it hardly affects customer satisfaction at all.
Just a small dip in FCR (First Contact Resolution) or employee engagement, however, sends customer satisfaction through the floor.
Performance
Performance, when defined as productivity, is the most common area of measurement.
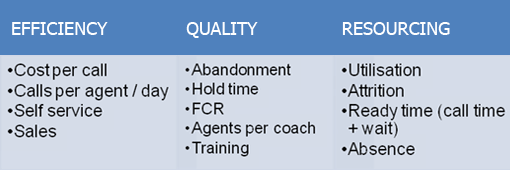
Most centres measure the same things:
As previously mentioned, however, there is no rule book for choosing your key performance indicators (KPIs); different companies have different strategies.
The list below shows the KPIs most high-performing centres are measuring. However, it is only when measuring employee engagement and customer satisfaction in parallel that they get the full advantage.
Call Wait Time
For example, call wait time only becomes useful as a measure when you also measure the customer satisfaction in relation to the same calls. That way you can see how far (and thus cost efficient) you are able to reduce your call wait time. That is the difference between standard performance measuring and a fuller holistic way of measuring.
Average Handling Time
Another good example is average handling time (AHT). Yes, this is a good tactical metric for managing individuals (for instance, when you want to see how you can improve sales and FCR) but it shouldn’t be a KPI because the AHT in itself doesn’t drive strategy, it drives the KPI. When we break down agents’ AHT versus sales and FCR figures we do not see a correlation; different agents have different ways of reaching higher FCR and conversion rates.
Hold Time
Contrary to what you may read in the media or remember experiencing from your last call to your telecoms provider; the average hold time is approximately one and a half to two minutes.
The problem is that during a year this fluctuates significantly and that there are a group of centres averaging 10 minutes hold time on average and it’s those experiences that we remember.
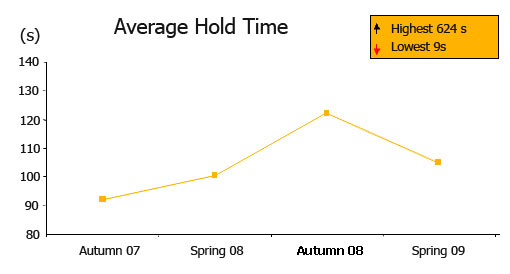
Even though we don’t see as strong an impact of this on customer satisfaction as previously thought, we do see an impact on conversion rates if the centre is up-selling.
Self Service
At the same time as you hear friends complain about endless IVR menus, in our benchmarking we see that the top performing centres have a high percentage of self-service calls.
Inbound customers like self service when it’s set up correctly and there is the option to speak to a live agent.
However, we saw a worrying trend increase from 16% to 22% of abandoned calls in self service from 2007 to 2008,* indicating that consumers are growing tired of poor scripts.
Agents per Team Leader
In search of differentiators amongst the top performers we analysed 800 reviews and saw that the centres with 8-15 agents per coach (or team leader) had a significantly better result on all of the other key metrics.* Above 15 the results dropped dramatically but under 8 the results stayed the same.
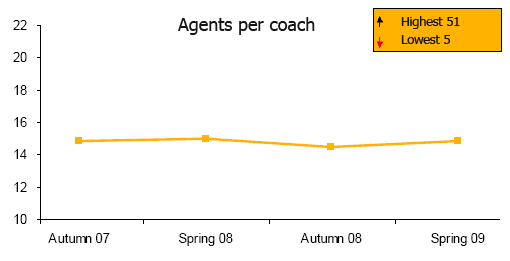
The top performers all have between 8 and 15 agents per coach. This results in:
Utilisation Level
The spread of outcome here is symptomatic of the wide range of performance levels in our industry. In 2008 the lowest utilisation level (incoming calls and talk time compared to the resources assigned to handle them) in the Bright Index benchmark was 18% and the highest 188%.
In the first case the centre has extreme over-capacity, in the latter the agents start every day knowing that they will hardly be able to handle half of the calls coming in.
Both are equally demotivating and neither is cost efficient.
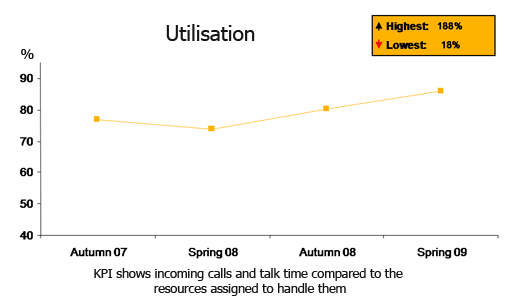
A recommended level is between 70% and 80%. At 100% we start seeing negative effects on absence and attrition (n.b. don’t mistake this metric for average talk time per agent and day which rarely goes over 70%).
Why customers call
Finally, the second area where we think the industry still isn’t getting it right is something as basic as asking why the customers call. We still see that a majority of centres don’t have an ongoing structured process for gathering the most frequent reasons for calls, and thus can’t do a proper root-cause analysis and so find themselves dealing with the same type of queries and problems over and over again.
Joining it all up
Measuring performance in parallel with employee engagement and customer satisfaction will make you feel like someone has switched on the light in a dark room.
More on this will follow in the second article in the series.
(*trends from Bright Index – Europe’s largest and most reliable bespoke benchmarking service – comprising 100 centres participating annually and 900 reviews in total.)

Mats Rennstam
Mats Rennstam is Managing Director at Bright UK Ltd