The Largest Online Community for Contact Centre Professionals
The Largest Online Community for Contact Centre Professionals

27th September 2017

Dave Appleby takes us through the basic requirements of setting up a call centre, from process blueprints to scheduling and forecasting.
Ok, so the time has come and business is good. Your existing team is doing OK but a few customers are getting missed. Callers are abandoning, customers are beginning to mutter. Staff are getting flustered. Dave Appeby asks – is it time to set up a call centre?
What’s actually changed? The product is still good. Sales are still high, but people are beginning to ask if your customer service is all it could be (or has been).
At the risk of getting into a grandmother and eggs situation, now is the time to look at how the existing operation works. It’s a what, why, where and when issue.
Calls come in, people rush to answer, more calls come in, everyone’s exhausted, and by the end of the day, no one can remember why the rush happened.
Customers were queuing, angry at the wait. Staff are shattered and know that tomorrow’s going to be the same. Staff absence and attrition rise. Things start to slide and before long it’s become the norm not the exception.
At this point (or preferably before): Stop, Think, Act.
Start with the calls coming in and track their progress through your system.
Points to work on.
i) When are calls arriving? It may seem like a simple question, but are you getting peaks and troughs? Is an initial surge causing a knock-on effect through the rest of the day?
ii) How does the existing process work? By empowering the advisors with the ability to do ONE thing is there a way to reduce call length or reduce the number of repeat calls/callbacks required?
iii) Does the process ‘bog down’ at any point? Is something acting as a speed ramp?
iv) What are the main causes of abandonment? Long wait, complicated call type, or is there some other reason?
v) How is existing technology being used?
I don’t intend to go into the full process here as there are plenty of resources on the market and internet that provide guidelines for how to do it. I will, however, make one proviso.
Let your existing staff know what’s happening and that it’s being done for their benefit.
I know from experience that the first thing that goes through an advisor’s head is “What am I doing wrong?” They know that there are problems from the nature of the work discussed above, and the presence of what can look like a witch-hunting team can drop morale even more.
The second thing to go through an advisor’s mind will be “My job’s on the line.” Closely followed by “They’re going to make us work harder.”
Let advisors know that it’s for their benefit, solicit their feedback and, above all else, be as minimally intrusive as possible.
Just to keep you on your toes. Looking at the points above and taking them in a totally different order from the way they are presented.
This is fairly simple to understand. Is there a reason a customer ALWAYS has to be transferred to another advisor/department or be called back? Is there one change you can make that will simplify the process?
Understanding your call-flow is the most fundamental piece of information you can have. While there are plenty of call-flow and workforce management software packages available, these are probably not required in the first instance.
As part of the process, call-flow should be mapped and compared to existing staffing levels at any given time of the day.
The graph below indicates call abandonment based on an advisor being able to handle four calls in a half-hour period.
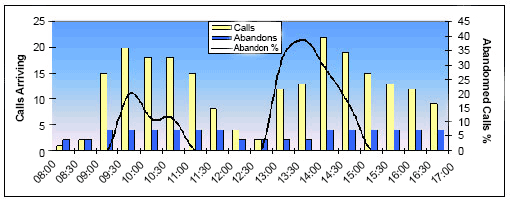
It takes lunch breaks into account but not any other breaks, and assumes calls arrive at a constant rate. Whilst we know this is not true, for the purposes of illustration, it’s a good enough model.
The graph below indicates what happens when you move the staffing levels by 1 in peaks and troughs.
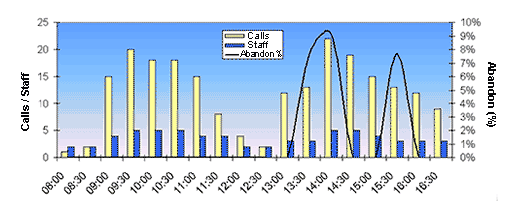
By making a minor adjustment to scheduling or calling an extra person onto the phones, the abandoned call rate has dropped from 26 to 4. This is at the cost of moving one and a half man hours from the back of the day to the front and 2 extra fill-in periods equalling 2 man hours.
As I’ve said, it’s a generalisation with even distribution so not quite ‘real word’, but good enough for demonstration.
The two graphs were produced using the data table below.
| Time |
08:00
|
08:30
|
09:00
|
09:30
|
10:00
|
10:30
|
11:00
|
11:30
|
12:00
|
12:30
|
13:00
|
13:30
|
14:00
|
14:30
|
15:00
|
15:30
|
16:00
|
16:30
|
|---|---|---|---|---|---|---|---|---|---|---|---|---|---|---|---|---|---|---|
| Call Arrival | 1 | 2 | 15 | 20 | 18 | 18 | 15 | 8 | 4 | 2 | 12 | 13 | 22 | 19 | 15 | 13 | 12 | 9 |
| Staff Example 1 | 2 | 2 | 4 | 4 | 4 | 4 | 4 | 4 | 2 | 2 | 2 | 2 | 4 | 4 | 4 | 4 | 4 | 4 |
| Staff Example 2 | 2 | 2 | 4 | 5 | 5 | 5 | 4 | 4 | 2 | 2 | 3 | 3 | 5 | 5 | 4 | 3 | 3 | 3 |
| Staff Difference | 0 | 0 | 0 | 1 | 1 | 1 | 0 | 0 | 0 | 0 | 1 | 1 | 1 | 1 | 0 | -1 | -1 | -1 |
| Abandon Rate Example 1 (%) | 0 | 0 | 0 | 20 | 11 | 11 | 0 | 0 | 0 | 0 | 33 | 38 | 27 | 16 | 0 | 0 | 0 | 0 |
| Abandon Rate Example 2 (%) | 0 | 0 | 0 | 0 | 0 | 0 | 0 | 0 | 0 | 0 | 0 | 8 | 9 | 0 | 0 | 8 | 0 | 0 |
| Abandon Calls Example 1 | 0 | 0 | 0 | 4 | 2 | 2 | 0 | 0 | 0 | 0 | 4 | 5 | 6 | 3 | 0 | 0 | 0 | 0 |
| Abandon Calls Example 2 | 0 | 0 | 0 | 0 | 0 | 0 | 0 | 0 | 0 | 0 | 0 | 1 | 2 | 0 | 0 | 1 | 0 | 0 |
| Agent Call per Hour 2 | 4 | 4 | 4 | 4 | 4 | 4 | 4 | 4 | 4 | 4 | 4 | 4 | 4 | 4 | 4 | 4 | 4 | 4 |
As I’ve said, a simple change, a massive result.
One of the biggest developments in technology in the last 30 years was the widespread introduction of the ACD telephone switch.
From the first ‘call centres’ in the early 70s, mainly amongst the American airline industry (which is why we still have ‘advisors’ on the phone today), the idea of a central contact point has expanded until it has become the normal method for a large company to service its customer base.
In fact, it’s worth noting that some large companies have gone back to the local contact point method (eg: banks) and are using it as a selling point.
From the first simple routing to the new hi-tech IP switches, technology in the contact centre has expanded and advanced at an almost exponential rate in the last 10 years. VOIP, CTI, Natural Voice Recognition and Universal Queues have all become buzzwords of the industry.
But, I hear you cry, what has this to do with me?
Absolutely nothing! is probably the easiest answer. An audit of existing technology may open some avenues that have previously been ignored.
Questions to ask yourselves are:
i) Do we just answer the phone or do we manipulate the incoming call at all?
ii) Do we get any reports from the switch or is it just shoving calls through?
iii) Do we have a team design or is it just a melee on the phones?
iv) Do we manage our phone activity? Are there set times for people to be on the phone?
At this point the audit is nearly finished. All that remains is to go back to the phone team and get each of them in turn to tell you where they think the problem is and suggest one solution.
You now have the basis to re-engineer the whole customer contact strategy.
Starting from the outside in. How does a customer contact you?
The process is probably something along the lines of:
Customer calls – This is purely the design of the existing telephone call. It does not reflect any background process issues affecting the customer.
Advisor handles call – With a simple process such as this, the call routing is easiest, and the customer has no idea of where they stand in relation to the rest of the calls arriving. Will they be answered in the next 10 seconds or is the wait going to be half an hour?
You all know as well as I do in this case the call is ALWAYS answered just as you decide to hang up and you hear the “Hello, thank you for calling…” just as you’ve gone past the point of no return in hanging up.
Although the system is simple, the scope for customer dissatisfaction is high. As with the staff rota example above, a few simple changes can lead to massive results in goodwill, customer and staff satisfaction.
Below are three examples of simple call routing changes (getting progressively more complex) that can be applied to most phone switches.
In this case at least the customer knows they are calling the correct company.
Once in the ACD, the customer’s call is then routed to the next available advisor, NOT the next person prepared to take a call.
The welcome message can also incorporate an out-of-hours message advising of opening hours or an emergency contact.
By the addition of a single voice menu, calls are now routed by team. The customer has one choice to make and can almost immediately speak to the next available advisor in the section they require.
Note the area in the dashed line is a loop until an advisor is available. The timings are between messages and the advisor availability check is continuous. Music can be added between the hold messages.
Below is a further refinement of the system giving the option for the customer to leave a message on an IVR (interactive voice response) system. This is the logical next step.
That being said, you need to refine the general business process to accommodate the call-backs generated by such a system.
The diagram below is the last of the general call-flow ones. These models use the assumption that all teams are separate. Other call-flow manipulation could include:
Both these options, however, mean that the teams have to be cross-trained on the other’s policies, procedures and scripting where required.
This is about as complex as most start-up call centres need to get, and the above facilities should be available either as part of the main package or as a bolt-on to any switch made after about 1985.
However, care needs to be taken in menu design. Nested menus, menus with four or more options, and overtly technical phrasing in the menu commands will ultimately drive abandon rates up.
Now the required set-up has been decided, it’s time to move onto the final section. This is where buy-in from the staff is at its most valuable.
As soon as you get to this point you can also capture messages out of hours.
The definition of service levels is a matter of great debate across the industry. Again argument rages about what measures to use, how many to use and how they are to be set.
In moving from an initial direct calls system to a distributed call basis, it is probably prudent in the first instance to define a couple of levels then play around until you have them working properly. Then as time progresses you can become more elegant both with the technological use of your switch and with the levels and measures you are using to chart progress.
So what service levels do we define?
Normally for a start your overall performance needs to be looked at; therefore a recommendation would be just three measures.
1. Average speed of answer
2. Abandonment rate
3. Service level
The first two are fairly obvious but the third is defined as: from the number of calls we answered how many fell within our target answer time?
As a starting place for defining your levels, benchmark indicators would be:
1. Target maximum answer time: 20 seconds
2. Target maximum abandon rate: 5%
3. Target service level: 80% (i.e. 80% of all answered calls to be answered in under 20sec – the conventional contact centre target service level)
In the beginning these should be looked at on a daily basis, then, as more information becomes available, start to capture your data in half-hour timeslots.
[For a more detailed run-down, read our article: How to Calculate Contact Centre Service Level]
Implementing the technology changes and setting service levels will do much to alleviate the problems caused by chaotic call-flow. Staff-level planning to meet call-flow will (if implemented correctly) solve the rest.
From the base measures described, the next step is to capture the average handle time of each call.
This is not only the talk time (ACD time) but also the after-call tasks (wrap time) required to complete the work before the advisor is ready to take another call.
Once you have the Average Handling Time (AHT) and your average call arrival you can start forecasting arrival.
Take the four weeks figures as below and a little manipulation will give you a basic forecast model.
This will be within 5-10% of what you can expect to happen, and will be adequate for a small enterprise.
Follow the link to find out: How to Calculate Forecast Accuracy
Take, for example, the call-flow below, across a four-week period (fig. 1). Although the calls vary week on week, we can take an average and calculate the mean call arrival (fig. 2). We then round this UP to the nearest whole number (fig. 3).
Call-Flow Across a Four-Week Period
| Week 1 | Mon | Tue | Wed | Thu | Fri | Week 2 | Mon | Tue | Wed | Thu | Fri |
|---|---|---|---|---|---|---|---|---|---|---|---|
| 08:00 | 5 | 6 | 5 | 6 | 7 | 08:00 | 1 | 6 | 7 | 6 | 6 |
| 08:30 | 6 | 7 | 5 | 3 | 6 | 08:30 | 2 | 3 | 4 | 4 | 5 |
| 09:00 | 7 | 7 | 7 | 9 | 10 | 09:00 | 6 | 5 | 5 | 4 | 4 |
| 09:30 | 10 | 9 | 8 | 10 | 12 | 09:30 | 12 | 14 | 14 | 16 | 11 |
| 10:00 | 15 | 8 | 14 | 20 | 21 | 10:00 | 13 | 15 | 15 | 16 | 20 |
| Week 3 | Mon | Tue | Wed | Thu | Fri | Week 4 | Mon | Tue | Wed | Thu | Fri |
| 08:00 | 1 | 6 | 8 | 2 | 2 | 08:00 | 4 | 5 | 4 | 5 | 6 |
| 08:30 | 1 | 6 | 5 | 3 | 5 | 08:30 | 2 | 7 | 6 | 4 | 6 |
| 09:00 | 2 | 8 | 8 | 6 | 8 | 09:00 | 6 | 6 | 6 | 8 | 9 |
| 09:30 | 3 | 9 | 12 | 12 | 18 | 09:30 | 4 | 10 | 13 | 13 | 19 |
| 10:00 | 8 | 9 | 10 | 10 | 14 | 10:00 | 9 | 10 | 11 | 11 | 15 |
The Mean Call Arrival
| Average | Mon | Tue | Wed | Thu | Fri |
|---|---|---|---|---|---|
| 08:00 | 2.75 | 5.75 | 6 | 4.75 | 5.25 |
| 08:30 | 2.75 | 5.75 | 5 | 3.5 | 5.5 |
| 09:00 | 5.25 | 6.5 | 6.5 | 6.75 | 7.75 |
| 09:30 | 7.25 | 10.5 | 11.75 | 12.75 | 15 |
| 10:00 | 11.25 | 10.5 | 12.5 | 14.25 | 17.5 |
To the Nearest Whole Number
| Average | Mon | Tue | Wed | Thu | Fri |
|---|---|---|---|---|---|
| 08:00 | 3 | 6 | 6 | 5 | 6 |
| 08:30 | 3 | 6 | 5 | 4 | 6 |
| 09:00 | 6 | 7 | 7 | 7 | 8 |
| 09:30 | 8 | 11 | 12 | 13 | 15 |
| 10:00 | 12 | 11 | 13 | 15 | 18 |
Now, taking the AHT, we can calculate the number of advisors required.
In this case I’m using a nice simple 300 sec (5 min).
Advisors Required in ½ hr = ( AHT * Calls)/1800. This gives the figures below.
| CALLS | AGENTS | ||||||||||
|---|---|---|---|---|---|---|---|---|---|---|---|
| Average | Mon | Tue | Wed | Thu | Fri | Average | Mon | Tue | Wed | Thu | Fri |
| 08:00 | 3 | 6 | 6 | 5 | 6 | 08:00 | 1 | 1 | 1 | 1 | 1 |
| 08:30 | 3 | 6 | 5 | 4 | 6 | 08:30 | 1 | 1 | 1 | 1 | 1 |
| 09:00 | 6 | 7 | 7 | 7 | 8 | 09:00 | 1 | 2 | 2 | 2 | 2 |
| 09:30 | 8 | 11 | 12 | 13 | 15 | 09:30 | 2 | 2 | 2 | 3 | 3 |
| 10:00 | 12 | 11 | 13 | 15 | 18 | 10:00 | 2 | 2 | 3 | 3 | 3 |
Unfortunately, whilst they represent a theoretically perfect figure, the figures above cannot be used, as they assume a ‘perfect world’ where calls arrive one after the other and staff work every minute.
Without working your staff to death, you can apply an arbitrary figure for expected productivity (anywhere between 60 and 75%) and then apply this.
So our formula changes to:
Using a figure of 65% for productivity, this would give a staffing level of:
| CALLS | AGENTS | ||||||||||
|---|---|---|---|---|---|---|---|---|---|---|---|
| Average | Mon | Tue | Wed | Thu | Fri | Average | Mon | Tue | Wed | Thu | Fri |
| 08:00 | 3 | 6 | 6 | 5 | 6 | 08:00 | 2 | 2 | 2 | 2 | 2 |
| 08:30 | 3 | 6 | 5 | 4 | 6 | 08:30 | 2 | 2 | 2 | 2 | 2 |
| 09:00 | 6 | 7 | 7 | 7 | 8 | 09:00 | 2 | 4 | 4 | 4 | 4 |
| 09:30 | 8 | 11 | 12 | 13 | 15 | 09:30 | 4 | 4 | 4 | 5 | 5 |
| 10:00 | 12 | 11 | 13 | 15 | 18 | 10:00 | 4 | 4 | 5 | 5 | 5 |
To the Nearest Whole Number
It is now reasonable to staff to these levels and expect to hit your service targets.
For more on this subject, read our article: How to Work Out How Many Staff You Need in a Contact Centre
Forecasting software normally employs a formula called Erlang-C to predict call-flow. Agner Erlang was a Danish mathematician who specialised in probability, and in 1908, whilst working for the Danish Telephone Company, he devised the Erlang-B and C formulas for predicting call arrival into switchboards.
He is thought of as the father of Queuing Theory.
Whilst much has changed, the formulas he discovered are still relevant today and are still (with a few minor changes) widely used.
Erlang calculations can increase the accuracy, but do you really want (in the first instance) to be using the formula below?
Didn’t think so!
[While this may look scary, you can always use an Erlang Calculator to help you with this].
When assigning breaks, one basic factor of human nature comes into play.
People call in the first or third quarter of an hour and will normally call in the first 10 minutes. So when assigning breaks it is both sensible and prudent to go for either the second or fourth quarter.
I hope this has given you a bit of an insight into how it is possible both practically and financially to improve your customer service side.
In fact, most of the points above require very little in the way of capital outlay.
As I’ve stressed above, though, the most important people in this equation are your customers and staff. All in all, can you afford not to make ‘one small change’?
You will probably need to create a project plan and a checklist to set everything up. We have complied two very useful checklists to help you with this.
We also have an article on how to turn all of this into a business plan. You can check the article out below:
Originally published in May 2009. Recently updated.
Dave Appleby has been working as a planner, forecaster and analyst in the contact centre industry for the last 16 years, having been a chef in a previous life. Starting off working on the phones for the launch of a Grocery Home Shopping service, he has worked for a variety of in-house and outsource operations, including Disneyland Paris, Seeboard, GIftaid, GM Finance and the Daily Telegraph. A keen diver (both instructor and cave diver), Dave is currently a senior analyst for a large UK insurance company.
Jo Robinson has worked at Call Center Helper since 2007. She started off as News Editor and is currently Operations Manager. Jo quality checks a large number of the articles on Call Centre Helper, along with caring for our customers, managing the eblast programme and sponsorship of our annual benchmarking survey.
Connect with Jo on LinkedIn
Read more by Jo RobinsonThe Latest Customer Contact Research, Reports and White Papers straight to your inbox!
Get the latest insights from Call Centre Helper by signing up for our email content.


24th September 2025
From Insight to Impact: The Next Era of CX and AI Leadership – Webinar