
The Largest Online Community for Contact Centre Professionals


The Largest Online Community for Contact Centre Professionals
 Close
Close



Published On: 5th Aug 2026 10:01
At Call Centre Helper, we’re committed to creating free, practical tools that help contact centres improve efficiency and planning.
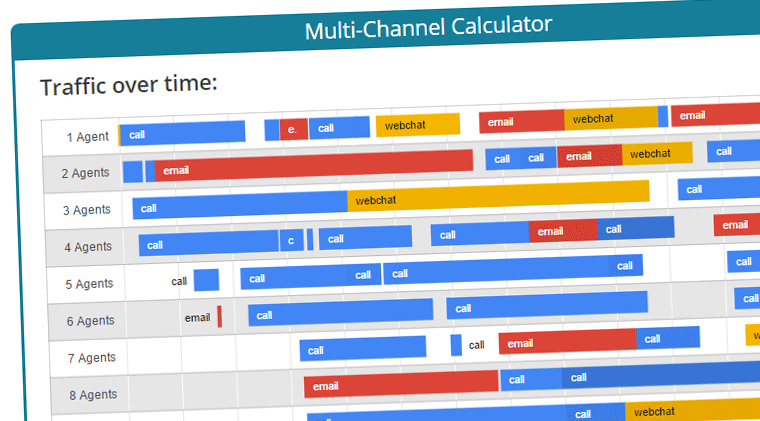
With this in mind we have created a Multi-Channel Contact Centre Calculator Tool, which is designed to simulate calls, emails, and webchats, making it easier than ever to estimate staffing needs across multiple channels.
Whether you’re forecasting for voice, digital or blended environments, this resource provides a simple yet powerful way to test service levels and optimise agent allocation, without spreadsheets or complex setups.
This calculator is like an Erlang Calculator, but even better.
It also allows you to calculate the number of staff that you need to service calls, emails and webchat.
This clever tool simulates the activity in the call centre. After inputting the number of calls emails and webchats, the calculator then generates a random simulation of traffic based on the Erlang (Poisson) Distribution.
It then simulates a call centre queue and allocates calls to agents.
This was written by Charley Pearce as his A level computing project. As you will understand, he got top marks for the project and is now studying Computer Science at University.
Access our latest version of the Multi-Channel Contact Centre Calculator Tool for contact centres
To start using the calculator enter the required inputs.
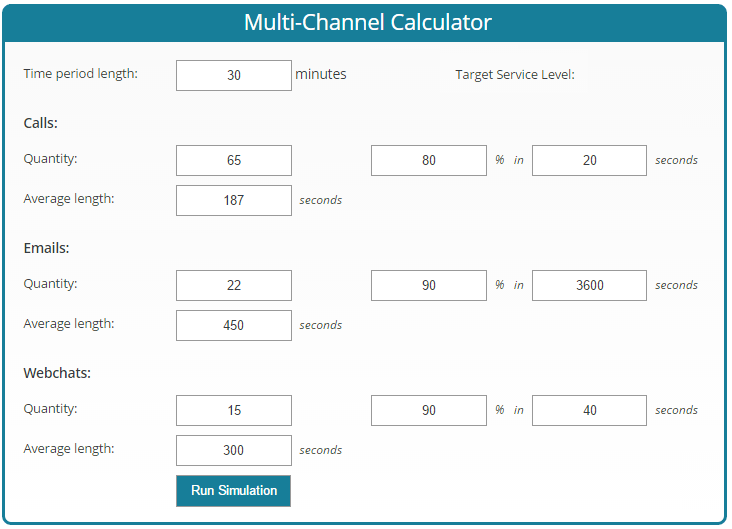
The calculator then shows the number of agents or advisors that are needed as well as the predicted service level that can be achieved. It also shows two nice graphs.
This shows the build-up of calls into the contact centre. It is colour coded so that calls are shown in blue, emails in red and webchats in orange.
If they have been waiting before being answered the colour depth changes. You can then hover your mouse across to see more details.
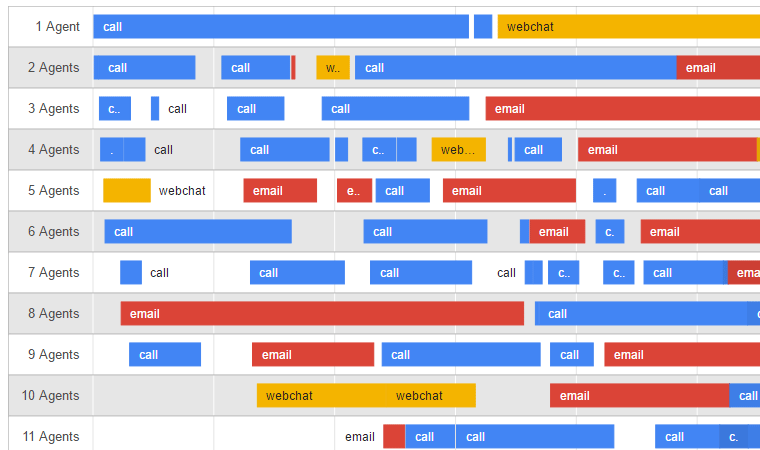
Note that it takes a while for the traffic to build up and to die down at the end of the time period. (This is known as overhang.)
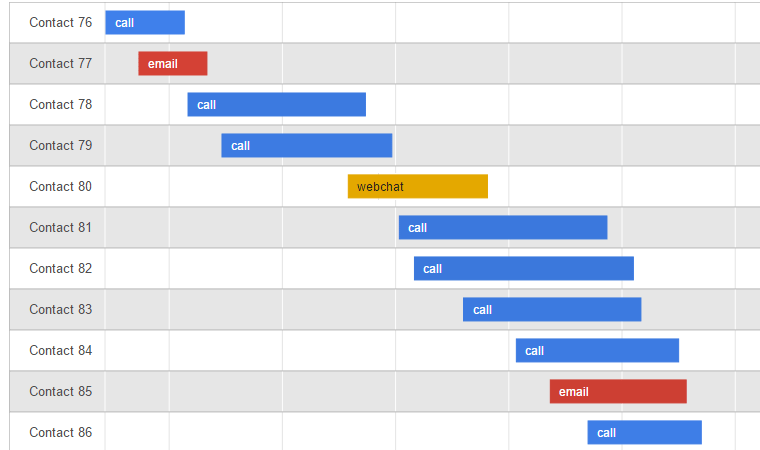
This shows just the number of contacts that had to queue before they were answered. Again this is colour coded.
To use the calculator simply:
The following page will give you the number of agents that the simulator needs to meet the service level targets.
The traffic-over-time chart shows the build-up of calls (blue), emails (red) and webchats (orange). The darker the colour, the longer the waiting time. The number of agents does not show the distribution of calls, just the number of agents that are required.
If you scroll down you will see the queue-over-time graph that shows the queue of calls (blue), emails (red) and webchats (orange). The darker the colour, the longer the waiting time.
Until we can get an understanding of the required traffic load on our servers, we are limiting the simulator to a maximum of 200 agents.
It is assumed that once you have allocated an email to an advisor, they keep working on that email until it is finished.
Access our latest version of the Multi-Channel Contact Centre Calculator Tool for contact centres
In a future version we are looking to enhance the calculator to get around these limitations.
For more useful contact centre tools and calculators, read these articles:
Reviewed by: Megan Jones

The Latest Customer Contact Research, Reports and White Papers straight to your inbox!
Get the latest insights from Call Centre Helper by signing up for our email content.
Close